

Metrics System On Kubernetes
![]()

![]()
For general information about the metrics of Alluxio, refer to Metrics-System.
To deploy Alluxio on Kubernetes, refer to Deploy Alluxio on Kubernetes.
This documentation focus on how to configure and get metrics of different metrics sinks from Alluxio deployed on Kubernetes.
HTTP JSON Sink
Configuration
The metrics are exposed through the web ports of different components.
- The web ports of Alluxio masters and workers are opened by default.
- Alluxio standalone Fuse web port is not opened by default. It can be opened by setting
alluxio.fuse.web.enabledto true.
Get Metrics Snapshot
You can send an HTTP request to an Alluxio process to get a snapshot of the metrics in JSON format.
# Get the metrics in JSON format from one specific component
$ kubectl exec <COMPONENT_HOSTNAME> -c <CONTAINER_NAME> -- curl 127.0.0.1:<COMPONENT_WEB_PORT>/metrics/json/

# For example, get the metrics of the leading master with default web port 19999
$ kubectl exec <alluxio-master-x> -c alluxio-master -- curl 127.0.0.1:19999/metrics/json/
# Get the metrics of a worker with default web port 30000
$ kubectl exec <alluxio-worker-xxxxx> -c alluxio-worker -- curl 127.0.0.1:30000/metrics/json/
# Get the metrics of the leading job master with default web port 20002
$ kubectl exec <alluxio-master-x> -c alluxio-job-master -- curl 127.0.0.1:20002/metrics/json/
# Get metrics of a job worker with default web port 30003
$ kubectl exec <alluxio-worker-xxxxx> -c alluxio-job-worker -- curl 127.0.0.1:30003/metrics/json/
# Get metrics of a fuse process with default web port 49999
$ kubectl exec <alluxio-fuse-xxxxx> -- curl 127.0.0.1:49999/metrics/json/
Visualization
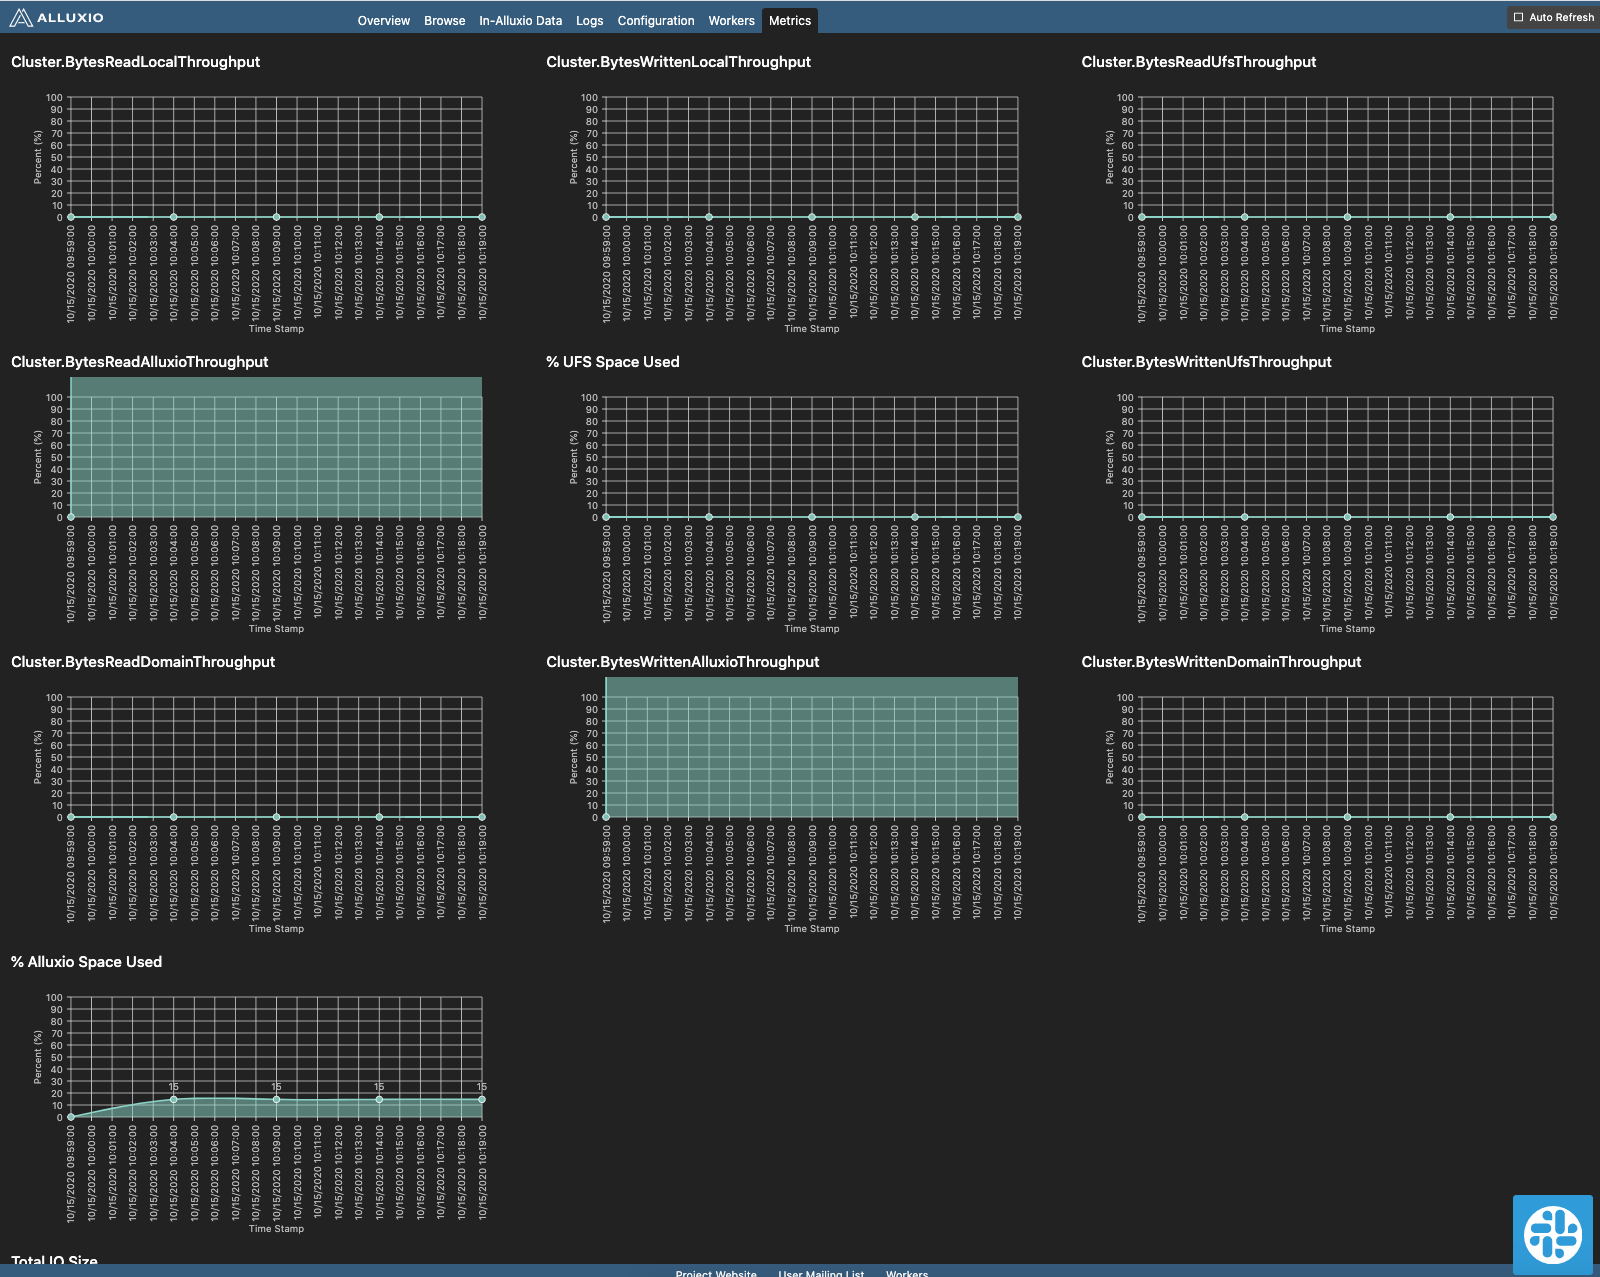
Master Web UI Metrics
Besides the raw metrics shown via metrics servlet or custom metrics configuration, users can track key cluster performance metrics in a more human-readable way in the web interface of Alluxio leading master.
To access the web UI of the leading master, you need to forward a port on a physical machine to the master web port.
For example, if your leading master is running in pod alluxio-master-0 and you want to serve the Alluxio master web UI at
node master-node-1 on port 8080, you can run the following command on your control plane:
$ kubectl port-forward <CONTROL_PLANE_HOSTNAME> pods/alluxio-master-0 8080:19999
The metrics can be then accessed at http://<leading_master_node_hostname>:<forwared_port>/metrics
Refer to Access the Web UI for more detailed instructions.
Prometheus Sink
Prometheus is a monitoring tool that can help to monitor Alluxio metrics changes.
Alluxio Helm Chart Configuration
PrometheusMetricsServlet needs to be enabled for Prometheus in Alluxio. Set the following properties in helm chart value.yaml to enable Prometheus metrics sink:
metrics:
  enabled: true
  PrometheusMetricsServlet: true
  podAnnotations:
    prometheus.io/scrape: "true"
    prometheus.io/masterWebPort: "<MASTER_WEB_PORT>"
    prometheus.io/jobMasterWebPort: "<JOB_MASTER_WEB_PORT>"
    prometheus.io/workerWebPort: "<WORKER_WEB_PORT>"
    prometheus.io/jobWorkerWebPort: "<JOB_WORKER_WEB_PORT>"
    prometheus.io/fuseWebPort: "<FUSE_WEB_PORT>"
    prometheus.io/path: "/metrics/prometheus/"
Note that similar to HTTP JSON Sink, fuse web port needs to be opened for accessing metrics by setting
alluxio.fuse.web.enabled to true.
Prometheus Client Configuration
For a Prometheus client to get the metrics from Alluxio, configure the prometheus.yml of the client. For example, to read the master metrics:
scrape_configs:
  - job_name: 'alluxio master'
    kubernetes_sd_configs:
      - role: pod
        namespaces:
          names:
            - alluxio # Only look at pods in namespace named `alluxio`
    relabel_configs:
      # Only check the pods with role `alluxio-master`
      - source_labels: [__meta_kubernetes_pod_label_role]
        action: keep
        regex: alluxio-master
      # Only check the pods with annotation prometheus.io/scrape is true
      - source_labels: [__meta_kubernetes_pod_annotation_prometheus_io_scrape]
        action: keep
        regex: true
      # Use the value of prometheus.io/path in podAnnotation for endpoint
      - source_labels: [__meta_kubernetes_pod_annotation_prometheus_io_path]
        action: replace
        target_label: __metrics_path__
        regex: (.+)
      # Use the value of prometheus.io/masterWebPort in podAnnotation for port
      - source_labels: [__address__, __meta_kubernetes_pod_annotation_prometheus_io_masterWebPort]
        action: replace
        regex: ([^:]+)(?::\d+)?;(\d+)
        replacement: $1:$2
        target_label: __address__
      - action: labelmap
        regex: __meta_kubernetes_pod_label_(.+)
      - source_labels: [__meta_kubernetes_namespace]
        action: replace
        target_label: namespace
      - source_labels: [__meta_kubernetes_pod_name]
        action: replace
        target_label: pod_name
      - source_labels: [__meta_kubernetes_pod_node_name]
        action: replace
        target_label: node
      - source_labels: [__meta_kubernetes_pod_label_release]
        action: replace
        target_label: cluster_name
To read other components’ metrics, use the respective pod role label and web port label.
An example configuration reading worker metrics
scrape_configs:
  - job_name: 'alluxio worker'
    kubernetes_sd_configs:
      - role: pod
        namespaces:
          names:
            - alluxio # Only look at pods in namespace named `alluxio`
    relabel_configs:
      # Only look at the pods with role `alluxio-worker`
      - source_labels: [__meta_kubernetes_pod_label_role]
        action: keep
        regex: alluxio-worker
      # Only check the pods with annotation prometheus.io/scrape is true
      - source_labels: [__meta_kubernetes_pod_annotation_prometheus_io_scrape]
        action: keep
        regex: true
      # Use the value of prometheus.io/path in podAnnotation for endpoint
      - source_labels: [__meta_kubernetes_pod_annotation_prometheus_io_path]
        action: replace
        target_label: __metrics_path__
        regex: (.+)
      # Use the value of prometheus.io/workerWebPort in podAnnotation for port
      - source_labels: [__address__, __meta_kubernetes_pod_annotation_prometheus_io_workerWebPort]
        action: replace
        regex: ([^:]+)(?::\d+)?;(\d+)
        replacement: $1:$2
        target_label: __address__
      - action: labelmap
        regex: __meta_kubernetes_pod_label_(.+)
      - source_labels: [__meta_kubernetes_namespace]
        action: replace
        target_label: namespace
      - source_labels: [__meta_kubernetes_pod_name]
        action: replace
        target_label: pod_name
      - source_labels: [__meta_kubernetes_pod_node_name]
        action: replace
        target_label: node
      - source_labels: [__meta_kubernetes_pod_label_release]
        action: replace
        target_label: cluster_name
An example configuration reading job master metrics
scrape_configs:
  - job_name: 'alluxio job worker'
    kubernetes_sd_configs:
      - role: pod
        namespaces:
          names:
            - alluxio # Only look at pods in namespace named `alluxio`
    relabel_configs:
      # Only look at the pods with role `alluxio-worker`
      - source_labels: [__meta_kubernetes_pod_label_role]
        action: keep
        regex: alluxio-master
      # Only check the pods with annotation prometheus.io/scrape is true
      - source_labels: [__meta_kubernetes_pod_annotation_prometheus_io_scrape]
        action: keep
        regex: true
      # Use the value of prometheus.io/path in podAnnotation for endpoint
      - source_labels: [__meta_kubernetes_pod_annotation_prometheus_io_path]
        action: replace
        target_label: __metrics_path__
        regex: (.+)
      # Use the value of prometheus.io/jobWorkerWebPort in podAnnotation for port
      - source_labels: [__address__, __meta_kubernetes_pod_annotation_prometheus_io_jobMasterWebPort]
        action: replace
        regex: ([^:]+)(?::\d+)?;(\d+)
        replacement: $1:$2
        target_label: __address__
      - action: labelmap
        regex: __meta_kubernetes_pod_label_(.+)
      - source_labels: [__meta_kubernetes_namespace]
        action: replace
        target_label: namespace
      - source_labels: [__meta_kubernetes_pod_name]
        action: replace
        target_label: pod_name
      - source_labels: [__meta_kubernetes_pod_node_name]
        action: replace
        target_label: node
      - source_labels: [__meta_kubernetes_pod_label_release]
        action: replace
        target_label: cluster_name
An example configuration reading job worker metrics
scrape_configs:
  - job_name: 'alluxio job worker'
    kubernetes_sd_configs:
      - role: pod
        namespaces:
          names:
            - alluxio # Only look at pods in namespace named `alluxio`
    relabel_configs:
      # Only look at the pods with role `alluxio-worker`
      - source_labels: [__meta_kubernetes_pod_label_role]
        action: keep
        regex: alluxio-worker
      # Only check the pods with annotation prometheus.io/scrape is true
      - source_labels: [__meta_kubernetes_pod_annotation_prometheus_io_scrape]
        action: keep
        regex: true
      # Use the value of prometheus.io/path in podAnnotation for endpoint
      - source_labels: [__meta_kubernetes_pod_annotation_prometheus_io_path]
        action: replace
        target_label: __metrics_path__
        regex: (.+)
      # Use the value of prometheus.io/workerWebPort in podAnnotation for port
      - source_labels: [__address__, __meta_kubernetes_pod_annotation_prometheus_io_jobWorkerWebPort]
        action: replace
        regex: ([^:]+)(?::\d+)?;(\d+)
        replacement: $1:$2
        target_label: __address__
      - action: labelmap
        regex: __meta_kubernetes_pod_label_(.+)
      - source_labels: [__meta_kubernetes_namespace]
        action: replace
        target_label: namespace
      - source_labels: [__meta_kubernetes_pod_name]
        action: replace
        target_label: pod_name
      - source_labels: [__meta_kubernetes_pod_node_name]
        action: replace
        target_label: node
      - source_labels: [__meta_kubernetes_pod_label_release]
        action: replace
        target_label: cluster_name
Get Metrics Snapshot
You can send an HTTP request to the Prometheus endpoint of an Alluxio process to get a snapshot of the metrics in Prometheus format.
$ kubectl exec <COMPONENT_HOSTNAME> -c <CONTAINER_NAME> -- curl 127.0.0.1:<COMPONEMT_WEB_PORT>/metrics/prometheus/

# For example, get the metrics of the leading master with default web port 19999
$ kubectl exec <alluxio-master-x> -c alluxio-master -- curl 127.0.0.1:19999/metrics/prometheus/
# Get the metrics of a worker with default web port 30000
$ kubectl exec <alluxio-worker-xxxxx> -c alluxio-worker -- curl 127.0.0.1:30000/metrics/prometheus/
# Get the metrics of the leading job master with default web port 20002
$ kubectl exec <alluxio-master-x> -c alluxio-job-master -- curl 127.0.0.1:20002/metrics/prometheus/
# Get metrics of a job worker with default web port 30003
$ kubectl exec <alluxio-worker-xxxxx> -c alluxio-job-worker -- curl 127.0.0.1:30003/metrics/prometheus/
# Get metrics of a fuse process with default web port 49999
$ kubectl exec <alluxio-fuse-xxxxx> -- curl 127.0.0.1:49999/metrics/prometheus/