
Monitoring and Metrics
![]()

Metrics provide insight into what is going on in the cluster. They are an invaluable resource for monitoring and debugging. Alluxio has a configurable metrics system based on the Prometheus Official Metrics Library. The metrics system exposes metrics in Prometheus exposition format.
Alluxio’s metrics are partitioned into different instances corresponding to Alluxio components. The following instances are currently supported:
- Coordinator: The Alluxio coordinator process.
- Worker: The Alluxio worker process.
- FUSE process: The Alluxio FUSE process, for both as a daemon set process as well as via CSI
Usage
Send an HTTP request to /metrics/ of the target Alluxio processes and get a snapshot of all metrics.
# Get the metrics from Alluxio processes
$ curl <COORDINATOR_HOSTNAME>:<COORDINATOR_WEB_PORT>/metrics/
$ curl <WORKER_HOSTNAME>:<WORKER_WEB_PORT>/metrics/
$ curl <FUSE_HOSTNAME>:<FUSE_WEB_PORT>/metrics/
For example, for the local processes:
# Get the local coordinator metrics with its default web port 19999
$ curl 127.0.0.1:19999/metrics/
# Get the local worker metrics with its default web port 30000
$ curl 127.0.0.1:30000/metrics/
# Get the local fuse metrics with its default web port 49999
$ curl 127.0.0.1:49999/metrics/
Integration
Prometheus
Configure the Prometheus service using the sample prometheus.yml to scrape the metrics. Note that the job_name should not be changed if the Grafana integration is needed.
global:
  scrape_interval: 60s

scrape_configs:
  - job_name: "prometheus"
    static_configs:
      - targets: [ 'localhost:9090' ]
  - job_name: "coordinator"
    static_configs:
      - targets: [ '<COORDINATOR_HOSTNAME>:<COORDINATOR_WEB_PORT>' ]
  - job_name: "worker"
    static_configs:
      - targets: [ '<WORKER_HOSTNAME>:<WORKER_WEB_PORT>' ]
  - job_name: "fuse"
    static_configs:
      - targets: [ '<FUSE_HOSTNAME>:<FUSE_WEB_PORT>' ]
Grafana
Grafana is a metrics analytics and visualization software used for visualizing time series data. You can use Grafana to better visualize the various metrics that Alluxio collects. The software allows users to more easily see changes in memory, storage, and completed operations in Alluxio.
Grafana supports visualizing data from Prometheus. The following steps can help you to build your Alluxio monitoring based on Grafana and Prometheus easily.
- Download the Grafana template JSON file for Alluxio: alluxio-dashboard-template.json
- Import the template JSON file to create a dashboard. See this example for importing a dashboard.
- Add the Prometheus data source to Grafana with a custom name, for example, prometheus-alluxio. Refer to the tutorial for help on importing a dashboard.
If your Grafana dashboard appears like the screenshot below, you have built your monitoring successfully.
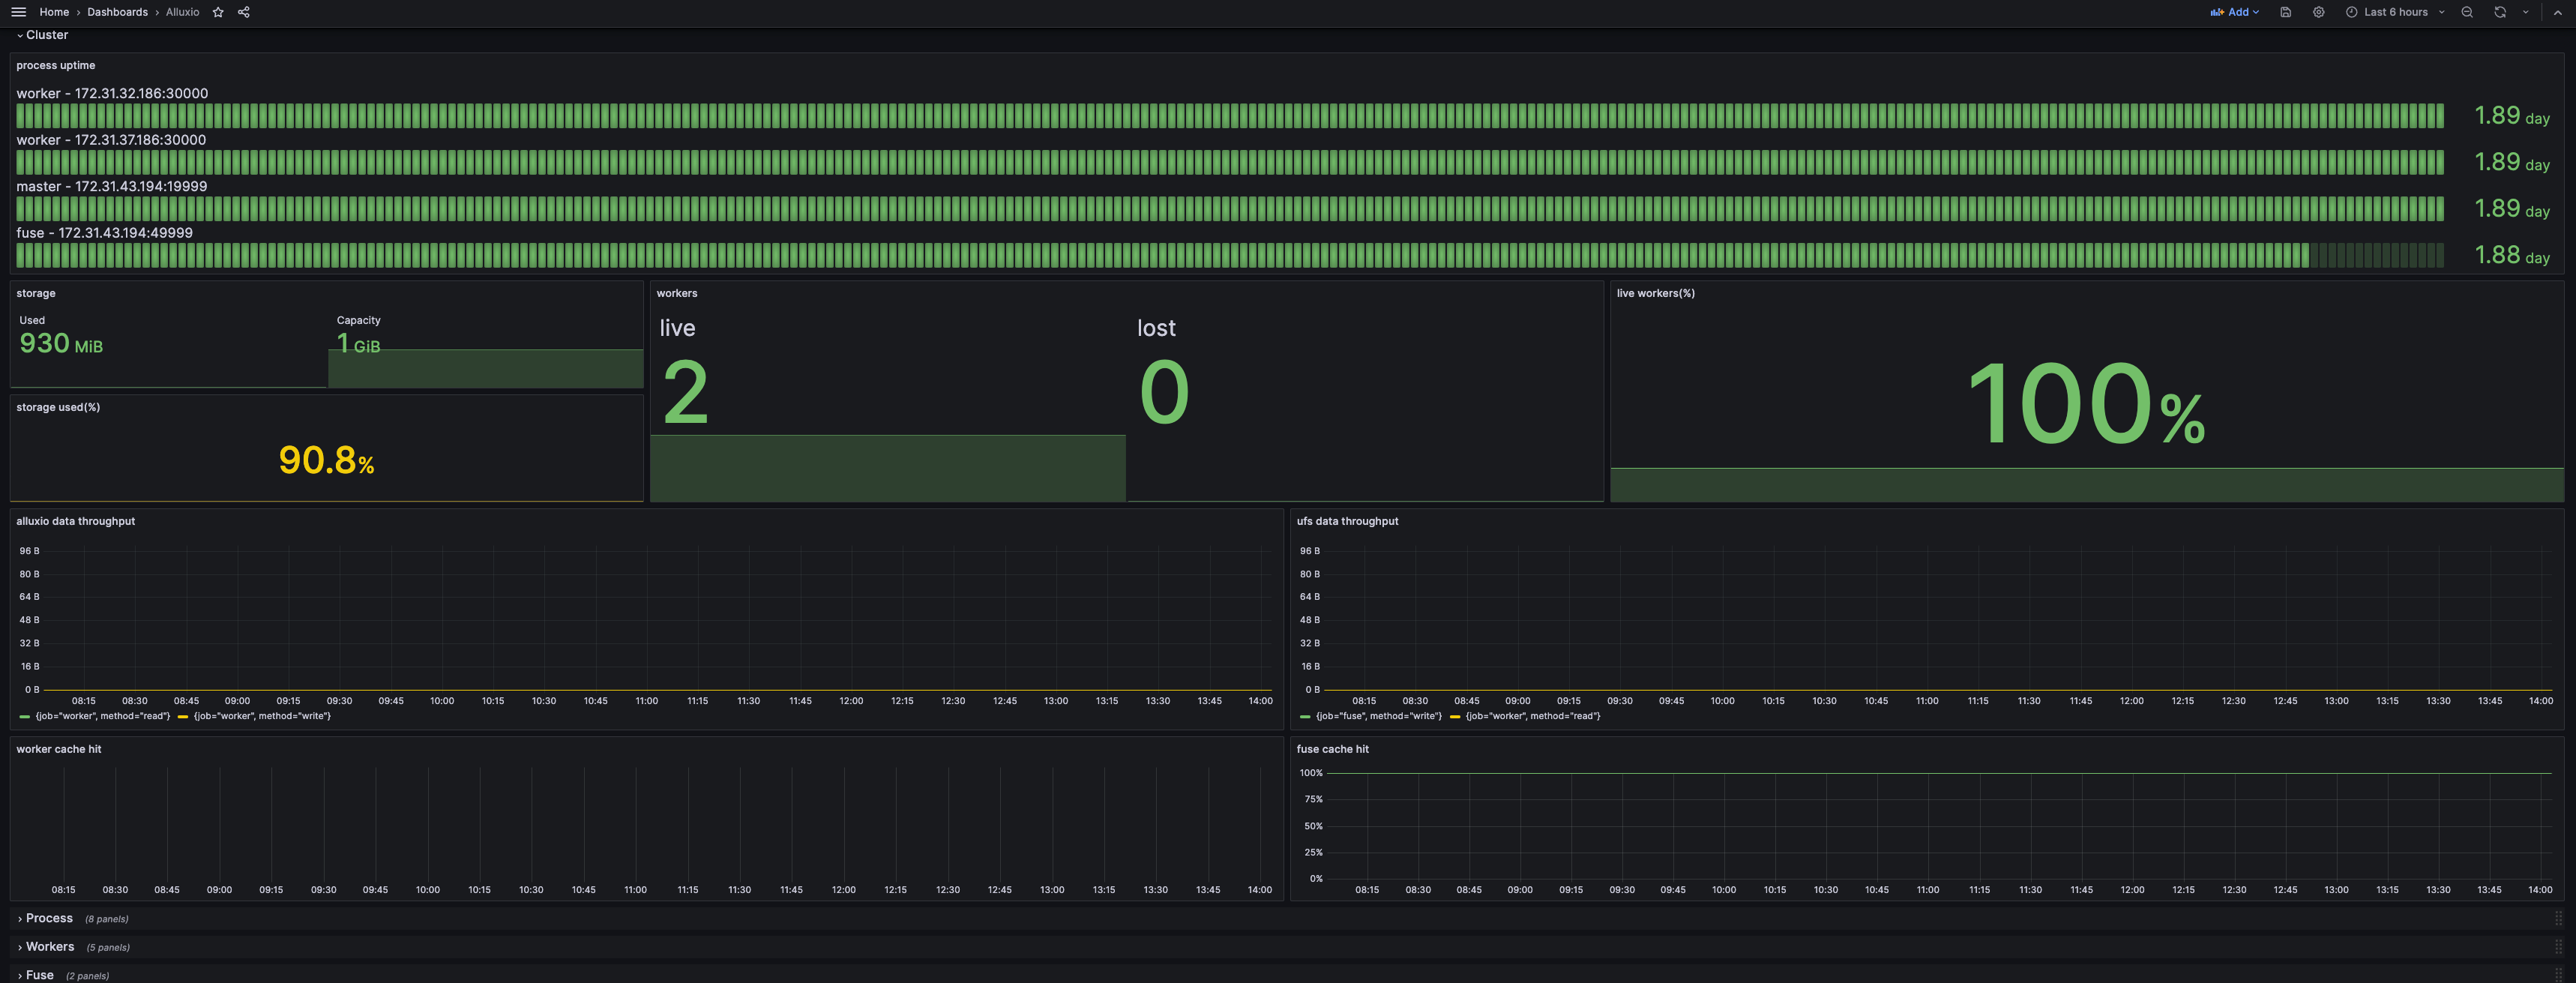
By default, only the Cluster row is unfolded, to show the abstract of the current status. The Process row shows the resource consumption and JVM-related metrics, which can be filtered by either services or instances at the top. The other rows show the details of certain components and can be filtered by instances.
Kubernetes Operator
The operator supports building a cluster with bundled Prometheus and Grafana. The configuration and the Grafana template are already included. Just set the following switch in the AlluxioCluster configuration:
spec:
  alluxio-monitor:
    enabled: true
Accessing Grafana via Node Hostname
The Grafana will expose its service on the 8080 port on its host. Use kubectl to get the hostname:
kubectl get pod $(kubectl get pod -l name=alluxio-monitor-grafana --no-headers -o custom-columns=:metadata.name) -o jsonpath='{.spec.nodeName}'
Assume the hostname is foo.kubernetes.org, then you can access the Grafana service on:
http://foo.kubernetes.org:8080/
Accessing Grafana via Port Forwarding
If you are unable to access Grafana directly through the node’s hostname due to network issues, you can use port forwarding to map Grafana’s port to your local machine, allowing you to access it locally.
Run the following kubectl port-forward command to set up port forwarding:
kubectl port-forward $(kubectl get pod -l app.kubernetes.io/component=grafana -o jsonpath="{.items[0].metadata.name}") 3000:3000
You can then access the Grafana service locally at:
http://localhost:3000
Prometheus with Kubernetes
Add the following snippet to the Prometheus configuration. The configuration will make the Prometheus scrape from the Kubernetes pods with certain annotations.
scrape_configs:
  - job_name: 'prometheus'
    kubernetes_sd_configs:
      - role: pod
        namespaces:
          names:
            - default
    tls_config:
      insecure_skip_verify: true
    relabel_configs:
      - source_labels: [__meta_kubernetes_pod_label_app_kubernetes_io_instance]
        action: keep
        regex: (?:alluxio-monitor-prometheus)
      - source_labels: [__meta_kubernetes_pod_label_app_kubernetes_io_component]
        action: keep
        regex: prometheus
      - source_labels: [__meta_kubernetes_pod_annotation_prometheus_io_scrape]
        action: keep
        regex: true
      - source_labels: [__meta_kubernetes_pod_annotation_prometheus_io_path]
        action: replace
        target_label: __metrics_path__
        regex: (.+)
      - source_labels: [__address__, __meta_kubernetes_pod_annotation_prometheus_io_port]
        action: replace
        regex: ([^:]+)(?::\d+)?;(\d+)
        replacement: $1:$2
        target_label: __address__
      - action: labelmap
        regex: __meta_kubernetes_pod_label_(.+)
      - source_labels: [__meta_kubernetes_namespace]
        action: replace
        target_label: namespace
      - source_labels: [__meta_kubernetes_pod_name]
        action: replace
        target_label: pod_name
      - source_labels: [__meta_kubernetes_pod_node_name]
        action: replace
        target_label: node
      - source_labels: [__meta_kubernetes_pod_label_app_kubernetes_io_instance]
        action: replace
        target_label: cluster_name

  - job_name: 'coordinator'
    kubernetes_sd_configs:
      - role: pod
        namespaces:
          names:
            - default
    tls_config:
      insecure_skip_verify: true
    relabel_configs:
      - source_labels: [__meta_kubernetes_pod_label_app_kubernetes_io_instance]
        action: keep
        regex: (?:alluxio)
      - source_labels: [__meta_kubernetes_pod_label_app_kubernetes_io_component]
        action: keep
        regex: coordinator
      - source_labels: [__meta_kubernetes_pod_annotation_prometheus_io_path]
        action: replace
        target_label: __metrics_path__
        regex: (.+)
      - source_labels: [__address__, __meta_kubernetes_pod_annotation_prometheus_io_port]
        action: replace
        regex: ([^:]+)(?::\d+)?;(\d+)
        replacement: $1:$2
        target_label: __address__
      - action: labelmap
        regex: __meta_kubernetes_pod_label_(.+)
      - source_labels: [__meta_kubernetes_namespace]
        action: replace
        target_label: namespace
      - source_labels: [__meta_kubernetes_pod_name]
        action: replace
        target_label: pod_name
      - source_labels: [__meta_kubernetes_pod_node_name]
        action: replace
        target_label: node
      - source_labels: [__meta_kubernetes_pod_label_app_kubernetes_io_instance]
        action: replace
        target_label: cluster_name

  - job_name: 'worker'
    kubernetes_sd_configs:
      - role: pod
        namespaces:
          names:
            - default
    tls_config:
      insecure_skip_verify: true
    relabel_configs:
      - source_labels: [__meta_kubernetes_pod_label_app_kubernetes_io_instance]
        action: keep
        regex: (?:alluxio)
      - source_labels: [__meta_kubernetes_pod_label_app_kubernetes_io_component]
        action: keep
        regex: worker
      - source_labels: [__meta_kubernetes_pod_annotation_prometheus_io_scrape]
        action: keep
        regex: true
      - source_labels: [__meta_kubernetes_pod_annotation_prometheus_io_path]
        action: replace
        target_label: __metrics_path__
        regex: (.+)
      - source_labels: [__address__, __meta_kubernetes_pod_annotation_prometheus_io_port]
        action: replace
        regex: ([^:]+)(?::\d+)?;(\d+)
        replacement: $1:$2
        target_label: __address__
      - action: labelmap
        regex: __meta_kubernetes_pod_label_(.+)
      - source_labels: [__meta_kubernetes_namespace]
        action: replace
        target_label: namespace
      - source_labels: [__meta_kubernetes_pod_name]
        action: replace
        target_label: pod_name
      - source_labels: [__meta_kubernetes_pod_node_name]
        action: replace
        target_label: node
      - source_labels: [__meta_kubernetes_pod_label_app_kubernetes_io_instance]
        action: replace
        target_label: cluster_name

  - job_name: 'fuse'
    kubernetes_sd_configs:
      - role: pod
        namespaces:
          names:
            - default
    tls_config:
      insecure_skip_verify: true
    relabel_configs:
      - source_labels: [__meta_kubernetes_pod_label_app_kubernetes_io_instance]
        action: keep
        regex: (?:alluxio)
      - source_labels: [__meta_kubernetes_pod_label_app_kubernetes_io_component]
        action: keep
        regex: (csi-)?fuse
      - source_labels: [__meta_kubernetes_pod_annotation_prometheus_io_scrape]
        action: keep
        regex: true
      - source_labels: [__meta_kubernetes_pod_annotation_prometheus_io_path]
        action: replace
        target_label: __metrics_path__
        regex: (.+)
      - source_labels: [__address__, __meta_kubernetes_pod_annotation_prometheus_io_port]
        action: replace
        regex: ([^:]+)(?::\d+)?;(\d+)
        replacement: $1:$2
        target_label: __address__
      - action: labelmap
        regex: __meta_kubernetes_pod_label_(.+)
      - source_labels: [__meta_kubernetes_namespace]
        action: replace
        target_label: namespace
      - source_labels: [__meta_kubernetes_pod_name]
        action: replace
        target_label: pod_name
      - source_labels: [__meta_kubernetes_pod_node_name]
        action: replace
        target_label: node
      - source_labels: [__meta_kubernetes_pod_label_app_kubernetes_io_instance]
        action: replace
        target_label: cluster_name
Notice that the job_name in the scrape_configs needs to be unmodified, since it’ll be used as filters in the dashboard.
The following metadata is required:
labels:
  app.kubernetes.io/instance: alluxio # used to distinguish different alluxio cluster
  app.kubernetes.io/component: worker # values from operator deployment are coordinator, worker, fuse, and csi-fuse. depends on the pod
annotations:
  prometheus.io/scrape: "true"
  # values should match with the port of the component. By default, it's 19999 for coordinator, 30000 for worker, and 49999 for fuse
  prometheus.io/port: "30000"
  prometheus.io/path: "/metrics/"
Datadog
Alluxio emits metrics in the Prometheus format, which allows Datadog to directly integrate with Alluxio.
- Ensure Datadog can access the ports listed in Prometheus integration
- Update Datadog configuration by adding multiple
prometheus_urlentries under theinstancessection in the configuration file
Example configuration snippet for polling multiple sources:
instances:
  - prometheus_url: <http://<alluxio-coordinator-instance>>:19999/metrics
  - prometheus_url: <http://<alluxio-worker-1-instance>>:30000/metrics
  - prometheus_url: <http://<alluxio-worker-2-instance>>:30000/metrics
  ...
By following these steps, Datadog can seamlessly collect and monitor Alluxio metrics, providing insights and visibility into your Alluxio cluster’s performance and health.